


As market researchers, we’re often seeking to understand how consumers make choices when purchasing specific products or services. An effective way to do this is through discrete choice modeling. Choice modeling allows researchers to understand individuals' tradeoffs in mock purchasing decisions. As a result, brands can optimize their products or services to best align with consumers' desires.
Discrete choice modeling encompasses several methodologies, including Maximum Differential Analysis (MaxDiff) and Conjoint Analysis. This article will explore both of these methodologies and when to use each.
MaxDiff
What is MaxDiff analysis?
MaxDiff, also known as Best-Worst scaling, presents a solution for understanding customer preferences among a long list of choices, such as potential product claims, package designs, or variants (e.g., flavors). It offers a practical way to compare and indicate preference without overwhelming participants. In this type of study, respondents are presented with several screens, each presenting a small subset of items, and asked to choose the best and worst options from each subset. Looking at choices made across the entire exercise, MaxDiff analysis reveals the relative preference of each item compared to the others, allowing researchers to understand which attributes are most important to consumers in purchasing. Unlike traditional ranking questions, this method also quantifies the degree of preference across the entire list, providing a comprehensive understanding of what consumers most care for and by how much. Companies and brands can use this output to make data-driven decisions that guide product development.
Designing a MaxDiff study
For a meaningful MaxDiff analysis, researchers should consider several factors in its setup.
First, it is essential to have a large enough list size to enable meaningful prioritization. We recommend a minimum of seven items. The list should accurately represent the range of potential options in consideration. Each item should be interchangeable, avoiding a mix of different attributes. For example, comparing various product colors is appropriate, but introducing other features like size or flavor is inappropriate.
While the items should be interchangeable, they need to be “testably different” (distinguishable from one another) so that respondents can rank them without confusion. For instance, light pastel pink, light pastel peach, and light pastel coral might not be distinguishable colors to respondents. Testing these colors may result in an unclear output.
Lastly, it’s important to note that sample size influences the accuracy and effectiveness of a MaxDiff analysis and resulting estimations. We suggest a sample size of 400–1000 respondents for the most reliable results.
MaxDiff exercise
In a MaxDiff exercise, respondents evaluate random subsets of three to five items from the total list across a series of screens until all items have been evaluated an approximately equal number of times. In each task, respondents select their top and bottom choices within each subset, expressing their most and least preferred items.
aytm offers several ways to present the subsets to respondents:
- Reorder Alternatives: Respondents view and arrange three to five items from most to least appealing.
- Best/Worst Alternatives: Respondents use thumbs-up and thumbs-down icons to indicate their top and bottom choices from a list of three to five items.
- Image Grid: Respondents view four images arranged in a 2X2 grid and select their top and bottom choices.
Each item is typically evaluated from one to three times, depending on factors such as the total number of items being tested, the number of items presented per subset, and the depth of analysis selected. Based on these factors, the aytm platform automatically determines an appropriate number of evaluations and thus how long of an exercise respondents will complete.
MaxDiff outputs
The output of a MaxDiff study provides insight into the relative importance or preference of different items within a list. It helps identify the most and least preferred options. aytm offers two ways to review the output of a MaxDiff study: Preference Likelihood and Utility Scores.
Preference Likelihood
Researchers commonly use Preference Likelihood (PL) because it's easy to understand. Preference Likelihood represents the likelihood of a specific item being chosen as the top choice within a random subset of items. aytm offers two variations of Preference Likelihood:
- Preference Likelihood (#/screen): This metric measures how likely an item is to be chosen as the favorite from a random subset, where the subset size matches the number of items displayed to respondents in each screen of the MaxDiff exercise. For example, if there are four colors (red, yellow, blue, and green) in a subset of potential backpack colors and red has a PL of 35%, there is a 35% chance that respondents will choose red as their preferred backpack color when presented as one of four different backpack colors from the list.
- Average-Based Preference Likelihood: This metric measures the likelihood of an item being preferred over another randomly selected item in the total list. In this case, the subset size is two: the item of interest and another random item from the list. For example, if red has an average-based PL of 35%, there is a 35% chance that respondents will choose it as their preferred backpack color when presented with any other color backpack from the list. A score above 50% suggests that the item performs better than the average.
How would you interpret an item having a Preference Likelihood (4/screen) of 35% compared to an item having an Average-Based Preference Likelihood of the same value (35%)? Random chance would suggest that an item that is preferred from a set of four options would be 25%, thus a PL (4/screen) of 35% is an above-average performer. As noted above, the random chance of one item being preferred over another item would be 50% (1 in 2), thus an Average-Based PL of 35% is a below-average performer.
Utility Scores
Utility Scores represent the relative preference of each item compared to the other items in the total list. These scores are zero-centered (meaning zero represents the middle of the pack or average) and can be positive (above average) or negative (below average). Interpreting and communicating the value of utilities directly can be challenging, which is why these scores are often transformed into other metrics—like Preference Likelihood—to help researchers understand the various appeal of each item.
Looking to see if performance between items or across subgroups is statistically significant? It is recommended to use utility scores for statistical tests given they are the untransformed outputs and are normally distributed. It is common to report Preference Likelihood measures for max interpretability with significance indicators from utility score-based stat testing.
Put your MaxDiff knowledge to the test with our brand new MaxDiff Advanced Certification.
Conjoint
What is conjoint analysis?
Conjoint analysis presents a solution for understanding customer preferences when there are multiple factors, each with multiple options, under consideration—this is the key difference between MaxDiff and conjoint analysis. By presenting and analyzing the underlying trade-offs respondents make between different combinations of possible options, often various product features such as brand, size, and price. It offers a way to understand how consumers make complex choices and identify the optimal combination of options or features.
aytm offers the most common form of conjoint exercise – Choice-Based Conjoint (CBC). CBC directly asks respondents to choose their preferred combination or package of options from a set of two to five choices determined by careful design to ensure equal and balanced evaluations across options. This setup simulates real-life decisions, such as a shopping experience, encouraging respondents to consider a product's overall offering rather than individual attributes or components. Respondents’ choices often reflect hidden or implicit preferences that influence decision-making, which conjoint analysis brings to the surface. Conjoint reveals the importance of each product feature and its value-add, enabling brands and companies to refine products, shape pricing strategies, and simulate market impact.
Designing a conjoint study
Conjoint analysis deconstructs a product into its constituent features, or “attributes”, assessing various combinations to determine how each feature affects customer preferences and choices, such as which product to purchase. And each attribute must have different options, or “levels”.
Let’s revisit our earlier example in which we tested backpack colors. If we were to conduct a similar study with a conjoint setup, the backpack color would be one attribute of the backpack, and the various colors (red, yellow, blue, and green) would be levels of the attribute.
An important attribute to include in a purchase-based conjoint exercise, or any exercise reflecting an exchange of money, is price. Price is the most common downside consumers face when deciding what to purchase or subscribe to, making it a critical trade-off to capture in your conjoint design and analysis. This forces respondents to evaluate the influence of price alongside the impact of different features and levels. Without price to consider, our crystal ball suggests consumers will strongly prefer the combination of all the best options.
Conjoint analysis requires a minimum of two attributes, each with at least two levels. As a general rule of thumb, we recommend testing no more than five features, each with a maximum of six levels. However, when thinking about the size of a conjoint design, it’s best to think about the number of possible combinations across all attributes and levels. A design of our recommended limits has 7,776 possible combinations (6 X 6 X 6 X 6 X 6). If we were to add a sixth attribute with four levels, the number of possible combinations would increase to 31,104. The aytm platform suggests a combination limit of 25,000.
Another element to consider adding to your design is a “none” option. In most decisions we make in our lives, not making a choice from the available alternatives or walking away is a potential decision. How many times have you begun shopping for an item only to walk away because none of the available options were of interest to you? Our guess is at least once! Including a “none” option can improve the simulated decision-making experience.
Conjoint Exercise
In a choice-based conjoint, respondents evaluate multiple product profiles (usually two to five) of various feature-level combinations. In each task, respondents select the profile of options they most prefer. When a "none" option is included in the design, respondents have the additional choice of "none of these".
The total number of scenarios presented to respondents depends on the size of the overall design, the number of alternatives per scenario, and the type of analysis selected.
Conjoint outputs
Conjoint effectively uncovers how different factors influence consumer decisions, quantifies the impact and preference of different features and levels, and determines the optimal combination of features and levels to drive consumer choice. aytm offers several ways to analyze the output of a conjoint study.
Preference Share
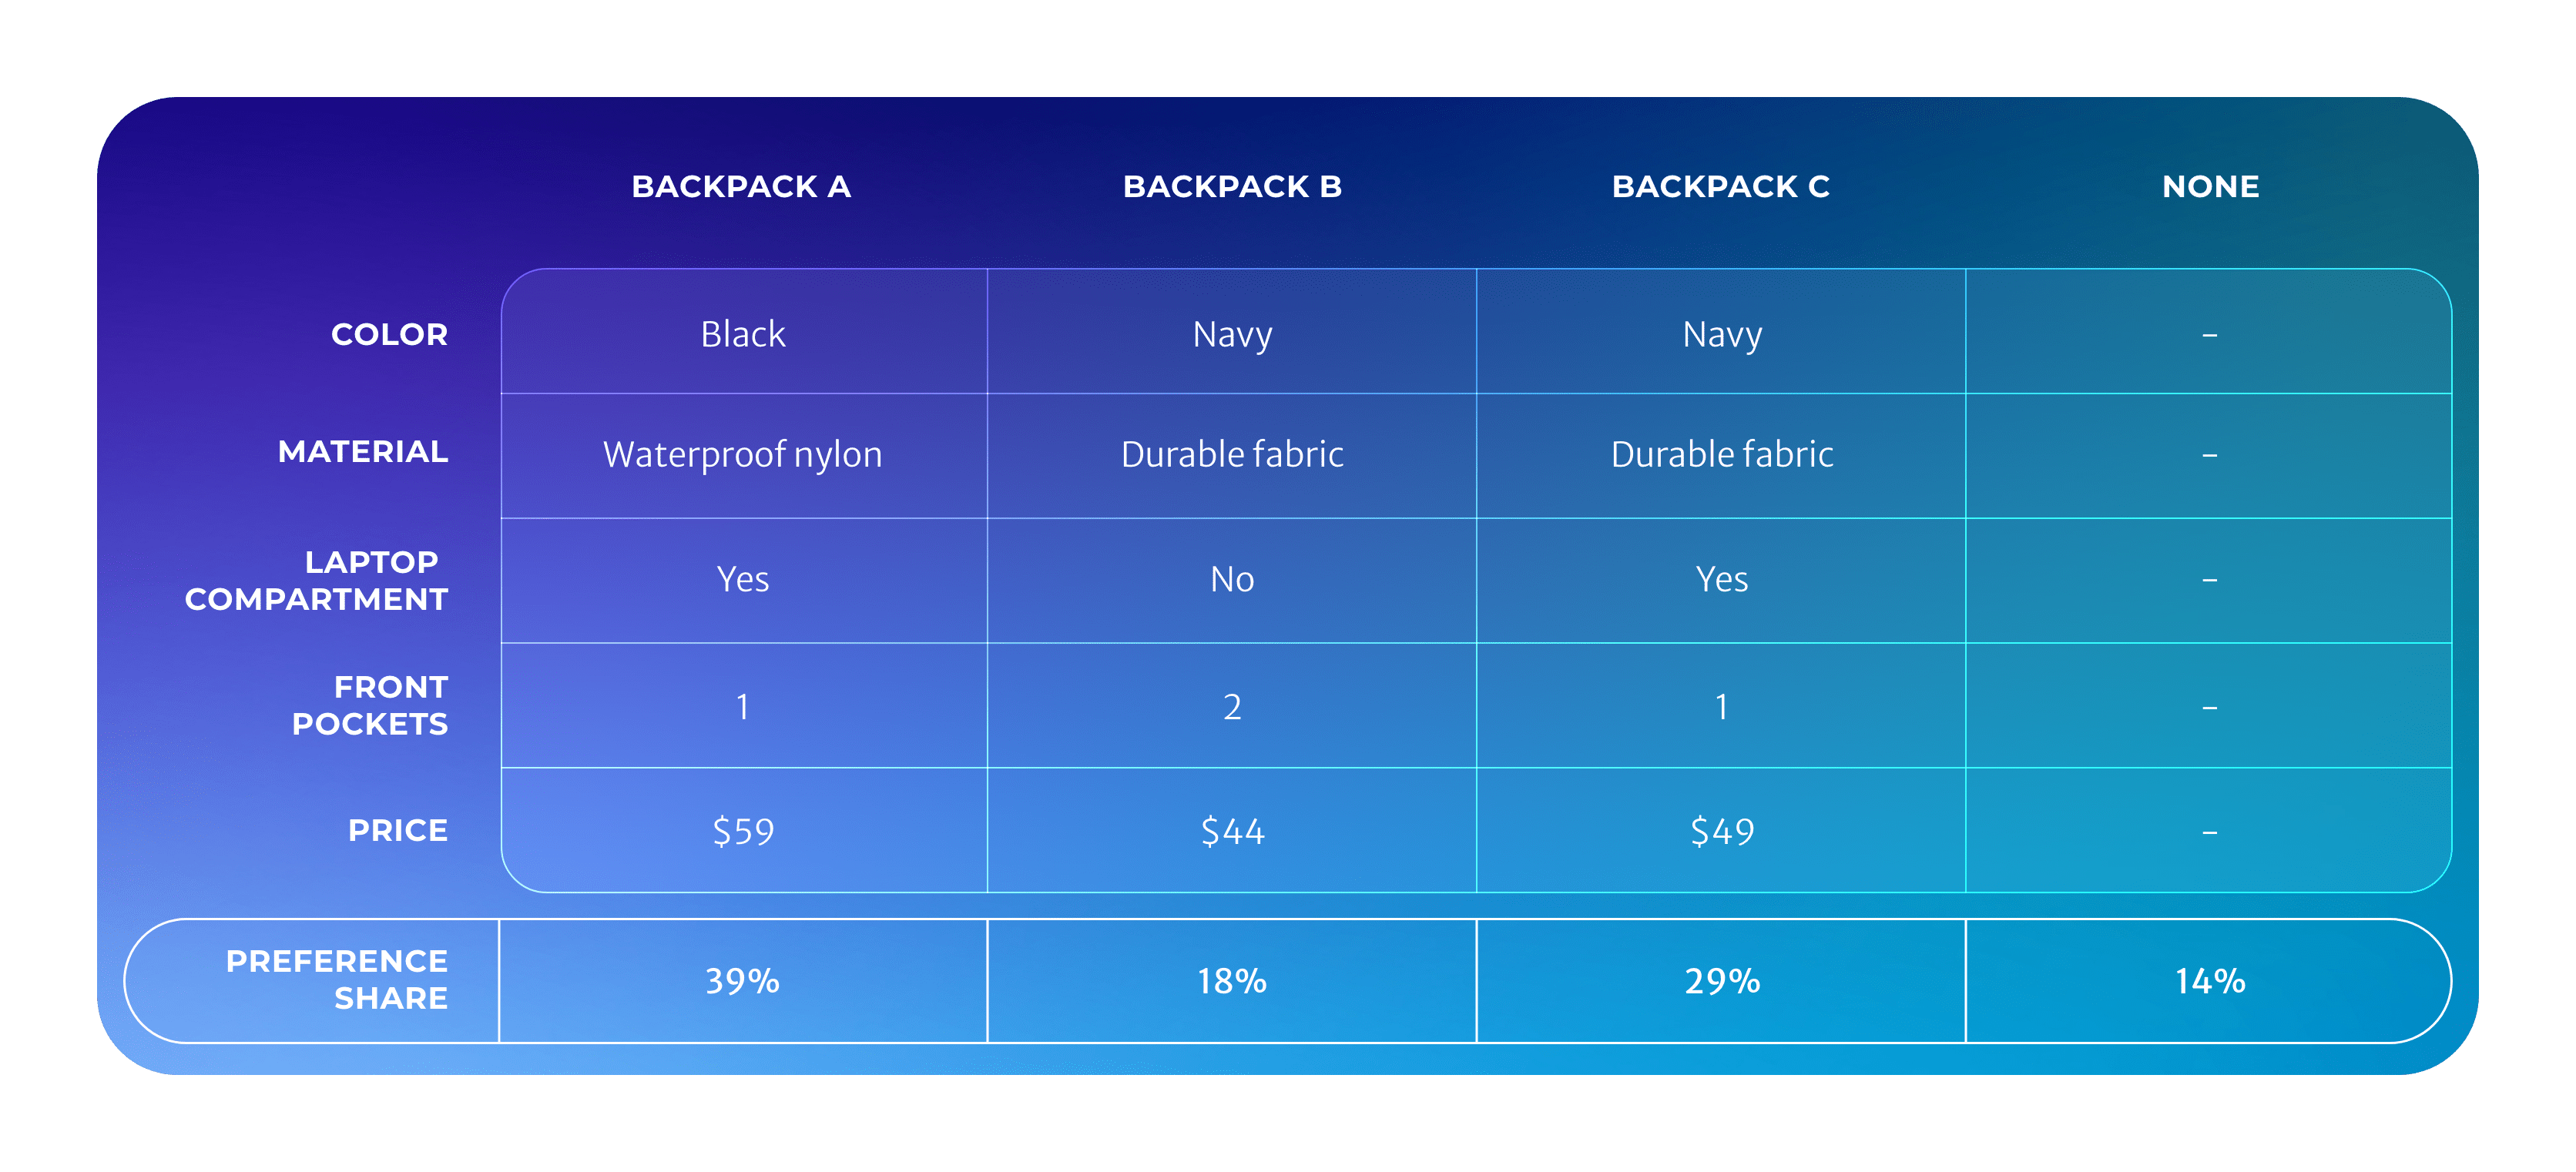
Preference Share is the most frequently reported metric from a conjoint analysis. It represents the likelihood that a consumer would choose a specific product profile over other options in a simulated market scenario, and it is meant to imitate the real-life choices consumers make.
Consider a conjoint exercise focusing on backpack preferences and the ideal backpack configuration. In the following market simulation of three backpack configurations with a None option, if Backpack A has a preference share of 39%, it suggests that approximately two-fifths of consumers would likely choose Backpack A over the other available options.
Preference Likelihood
Preference Likelihood represents the likelihood of a specific product profile being preferred over an average option. This metric ranges from 0 to 100 and should be interpreted relatively. For instance, if Backpack A has a Preference Likelihood of 75, it is three times as likely to be preferred to an average alternative.
Attribute Importance and Utility Scores
Attribute Importance is the relative importance of each feature included in the conjoint exercise, adding up to 100%. In our backpack study with five attributes, if backpack color is found to have an attribute importance of 25%, it suggests that color accounts for one-quarter of consumers' backpack purchase decisions.
Utility Scores represent the relative value of each option compared to the other options within a feature. Another name for these conjoint scores is part-worths, as they are the value of different parts that are then combined into a whole. Like with MaxDiff, these scores are zero-centered (meaning zero represents the middle of the pack or average) within each feature. Those with positive scores are considered above average while negative scores are below average, with higher scores representing greater preference when comparing alternatives within the same feature. Scores for options under different features should not be directly compared.
It’s best to interpret Attribute Importance and Utility Scores (Part-Worths) directionally, as they’re subject to bias and often don’t tell the full story—particularly how certain combinations may be more powerful together but wash out when viewed independently. It’s strongly advised to draw more robust insights from the metrics that consider how the components come together, like Preference Share or Preference Likelihood.
How to decide when each methodology is appropriate
When deciding if a MaxDiff or conjoint analysis is a good fit for your objectives, consider the nature of the insights you're seeking and the decisions you need to make.
MaxDiff is a valuable tool when you need to prioritize a set of alternatives, like potential product claims. It helps you understand the relative rank and preference of the different options to see what rises to the top and falls to the bottom. A MaxDiff exercise may be the final step in determining the right options to proceed with, potentially used as the basis for a TURF analysis to identify an optimal lineup of options, or as a tool in early stages to narrow down a large list of potential ideas into the best candidates for further consideration and testing.
Conjoint analysis is better suited for understanding how different attributes perform and work together to drive choices with multiple factors, with the ability to simulate various scenarios. It is the more appropriate choice when you have multiple variables and levels to test within each variable, such as designing or optimizing an overall product offering.
Both methodologies are dependent exercises, meaning everything in the test influences each other, and considerations omitted from the test are not accounted for. Said another way, you cannot determine how the results would have shifted if an option or set of options were not included, nor can you determine how the results would have been impacted if an outside option were introduced. This makes MaxDiff and Conjoint poor options when an independent, absolute measurement is preferred.
Ultimately, MaxDiff serves to prioritize a specific aspect, while conjoint serves to optimize an overall package. Understanding the strengths of each will help you select the best-fitting methodology for your research objectives. By utilizing these methodologies, researchers can gain deeper insights into consumer preferences by observing behavior in the form of choices and deriving importance or value of options, ensuring that products and services are tailored to meet the desires of their audience based on how they actually make choices and not how they think they make choices.


.webp)


.jpeg)


